A Personal Census Atlas
URL coming soon
Spring 2019 - ongoing
Census data, Python, Javascript

Below are the steps taken to build a personal Census atlas
1. Overviews are created to explore and validate the data visually. Here below is the overview of location records by date, showing some gaps for international travel when the phone was not in use.

2. The time spent in each tract is tallied and ranked. Below is a selection of tracts where our subject spent the most time.

3. Further narrowing the locations by time spent, we found these top 9 tracts within which our subject spent more than 50% of their overall time.

4. Assembly of 9 top tracts into an island for one.

5. The island of Census tracts emerges

6. The Census demographics of our island. Here are some comparisons between the island and the rest of the country.


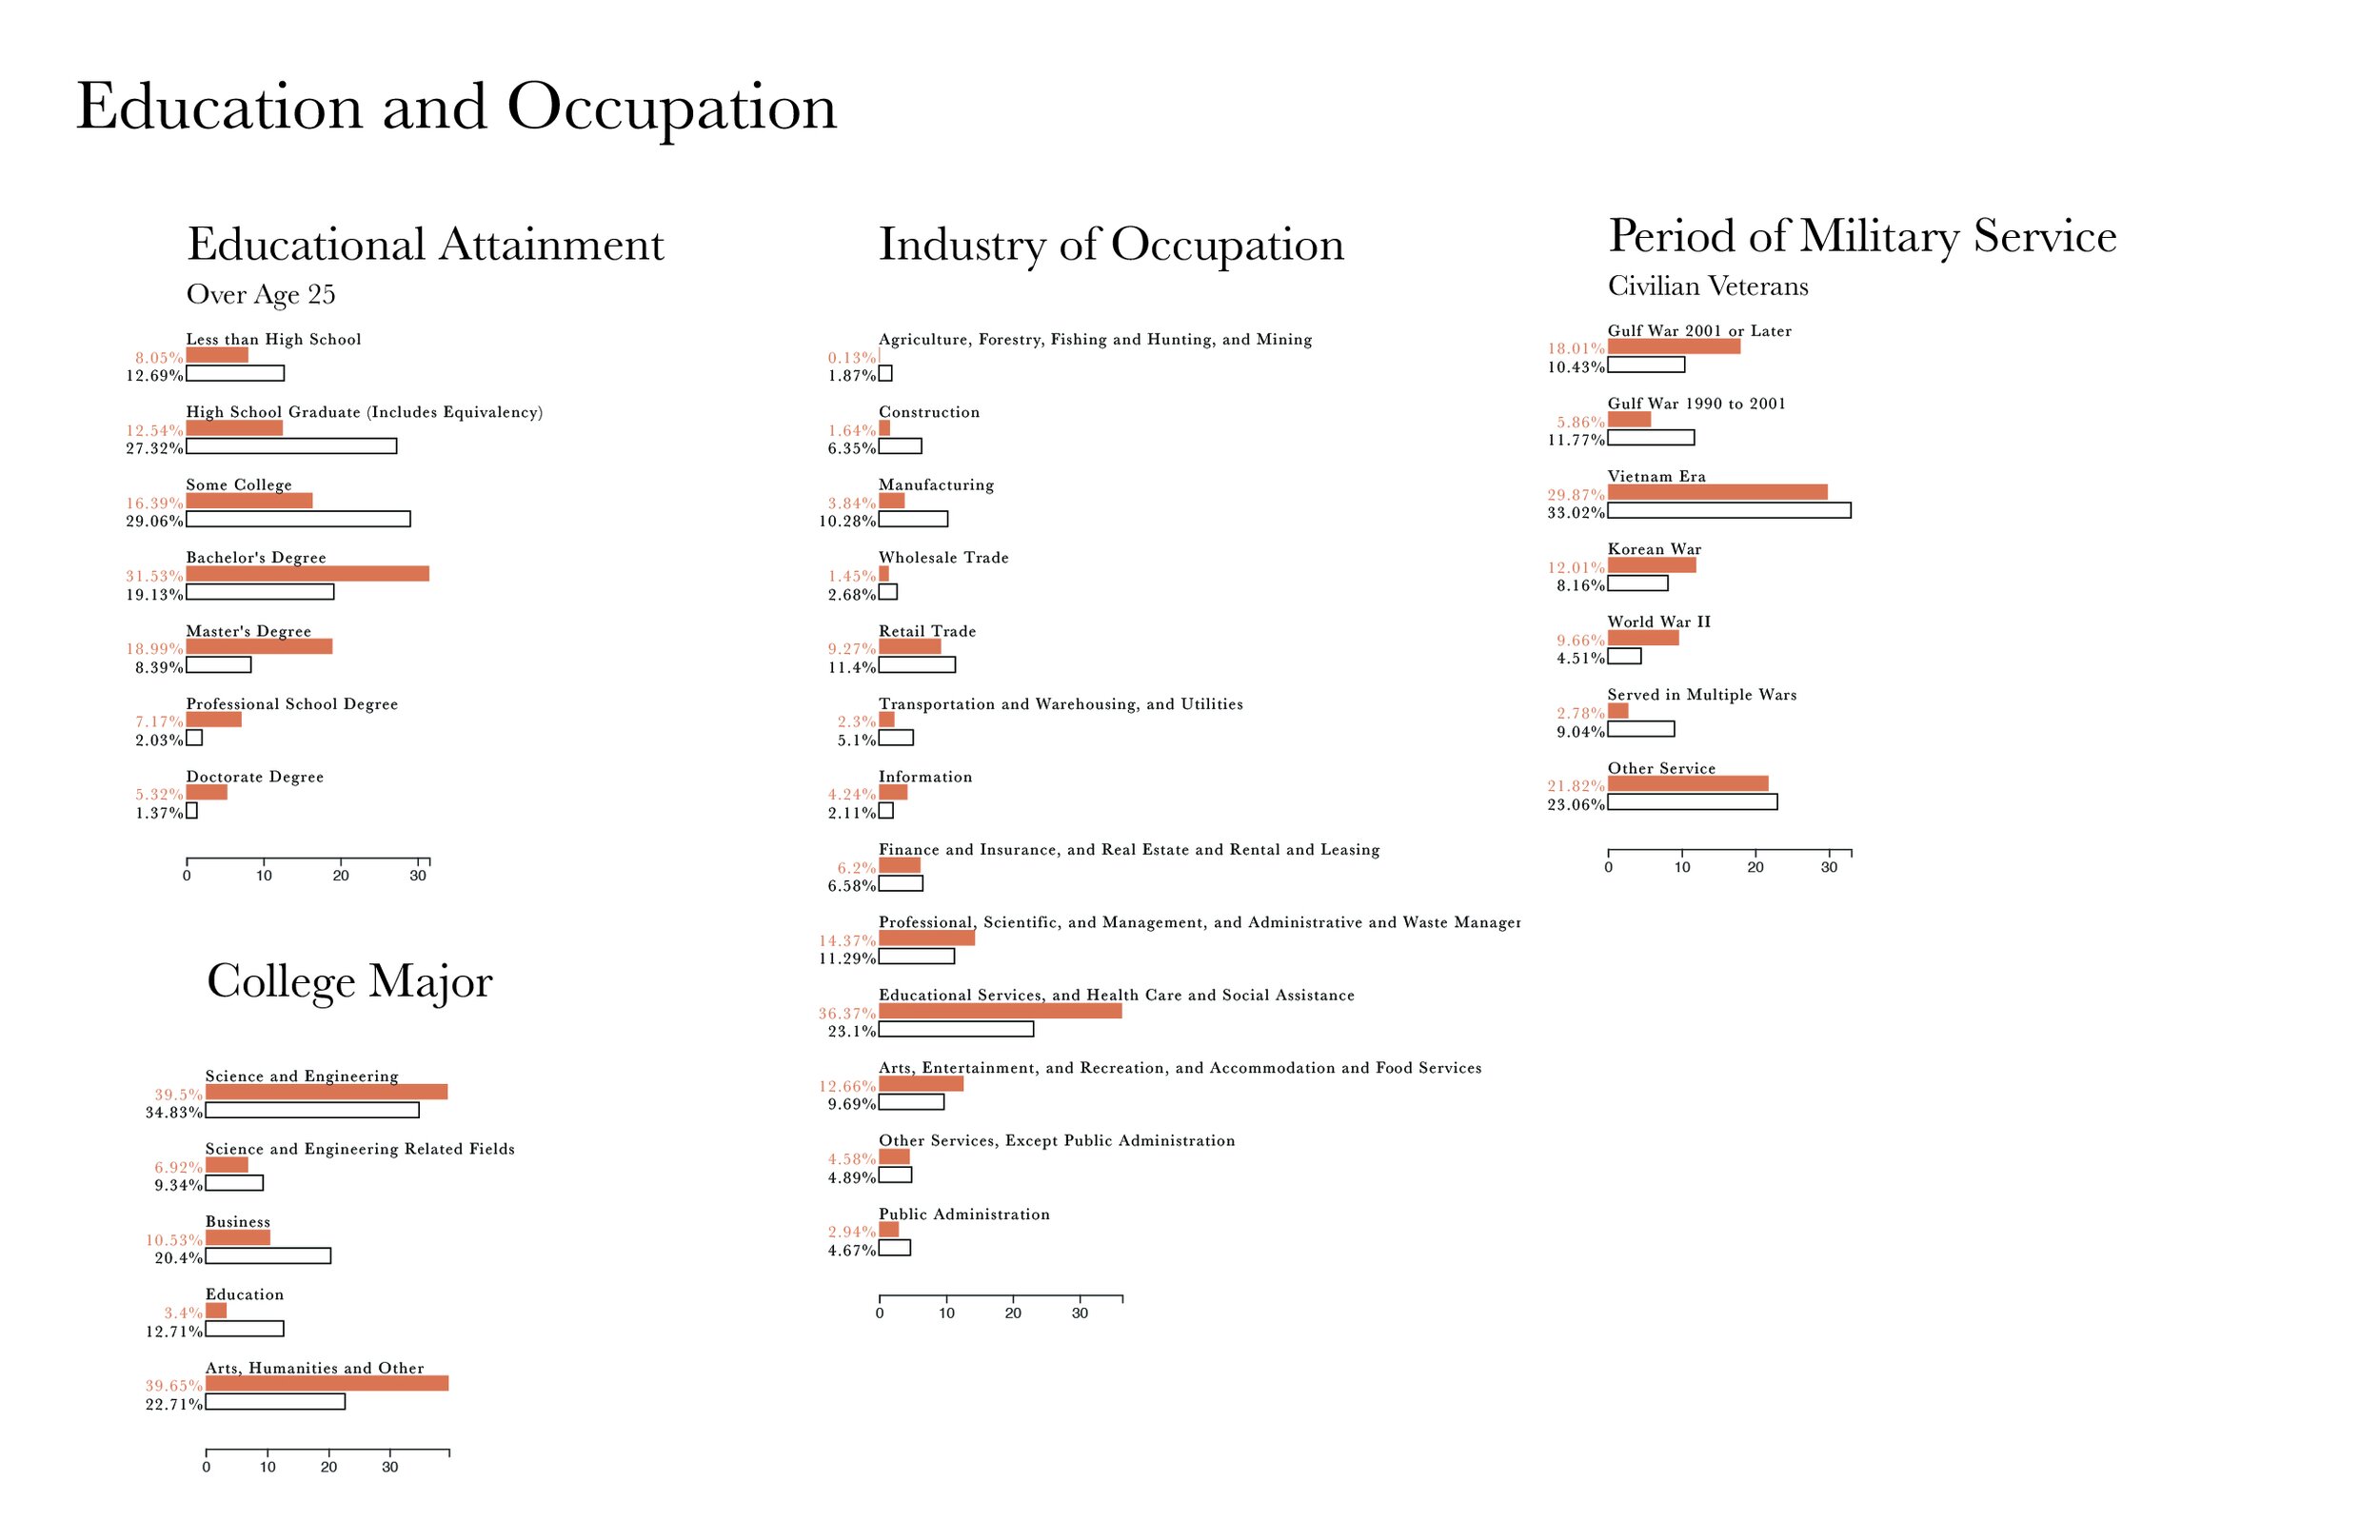

7. Finally a summary of the characteristics of the place is made.

This is in progress as a printed atlas that also covers the places that also covers other aspects of the location data collected, such as demographics of places just outside of the areas frequented, as well as places that are passed through.
This project visualizes the U.S. Census through the lens of 1 person’s location data over the course of 3 years. It uses location tracking to personalize public aggregate data. The project creates an hypothetical island out of census tracts where our subject spends the majority of their time and compares the demographics of this island to the rest of the country.

By juxtaposing geolocations and Census data, this project is able to create a demographic profile of the subject based on the places they visit. This is a similar process used by companies and applications to profile users. We are constantly viewed through data collected from us, can we derive benefits from seeing ourselves in a similar way? It possible to read aggregate data through the lens of self knowledge?